The basics
Connecting your data
- Uploading data to Datashift
- Proper data format for uploading
- Working with different file types
- Types of data Datashift can read
Working with projects
Working with data
- Datafile options
- Adding and deleting data
- Linking datafiles together
- Appending datafiles together
- Re-loading data
- Making data update in real-time
- Downloading individual datafiles
- Renaming datafiles
- Data headers
- Adding meta data
- Performing calculations on your data
- Working with alerts
Working with dashboards
Working with your team
Quick start guide
This quick start guide will help learn how you can use Datashift to manage your data.
This section is broken down into 5 sections:
1. Create a project
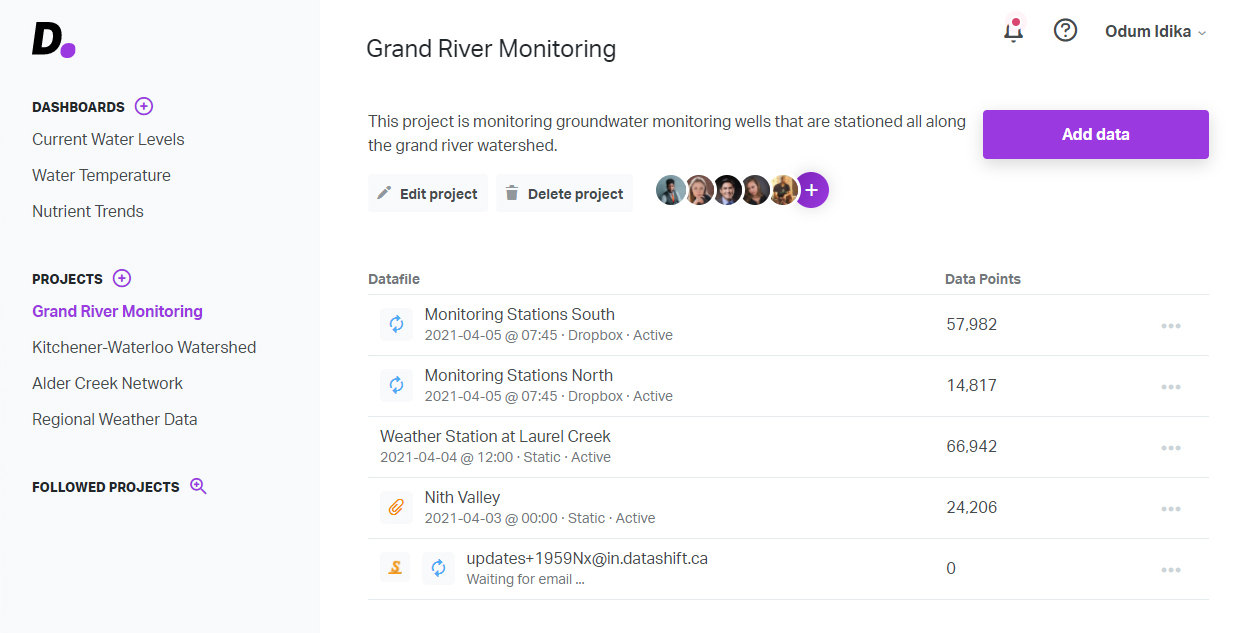
Projects are how you organize your data accoring to your work. Once data are grouped into a project they can be visualized and analyzed at any time.

To create a project:
- Click on the button beside the headingProjectson the left side menu.
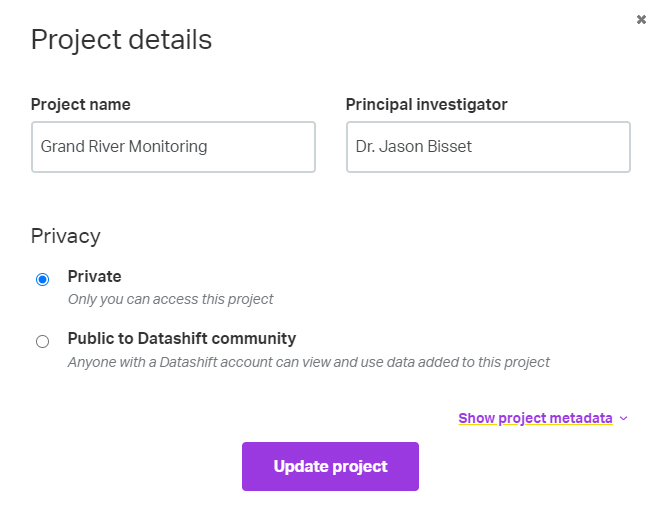
- Add a name, description and privacy settings for your project.
2. Add a datafile
A Datafile is what we call a singular file which contains data. When adding datafiles you need to make sure that your file follows a standard format, otherwise it will fail to load into your project.
A Datafile must consist of one table of data. You cannot add spreadsheets with multiple tables or sheets. Your data must contain at most only 1 row of headers.
Tip: Only the owner of a project (the creator) or a project admin can add datafiles to the project. The project owner can set a single member as an admin.
To add a datafile:
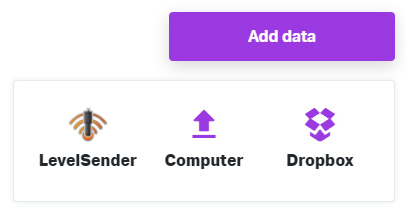
- Within a project, click the "Add data" button on the top right corner.
- Choose to either add a file from your computer, Dropbox, or Solinst Levelsender.

- Click "Upload" to add your datafile or copy the unique email to add it to your LevelSender if connecting to Solinst loggers.
If you're datafile failed to load please review the file types and data formats that Datashift can read.
If your datafiles are very complex, get in touch with one of our expert data integration specialists and they will work with you to build a custom solution for you.
3. Create a graphic
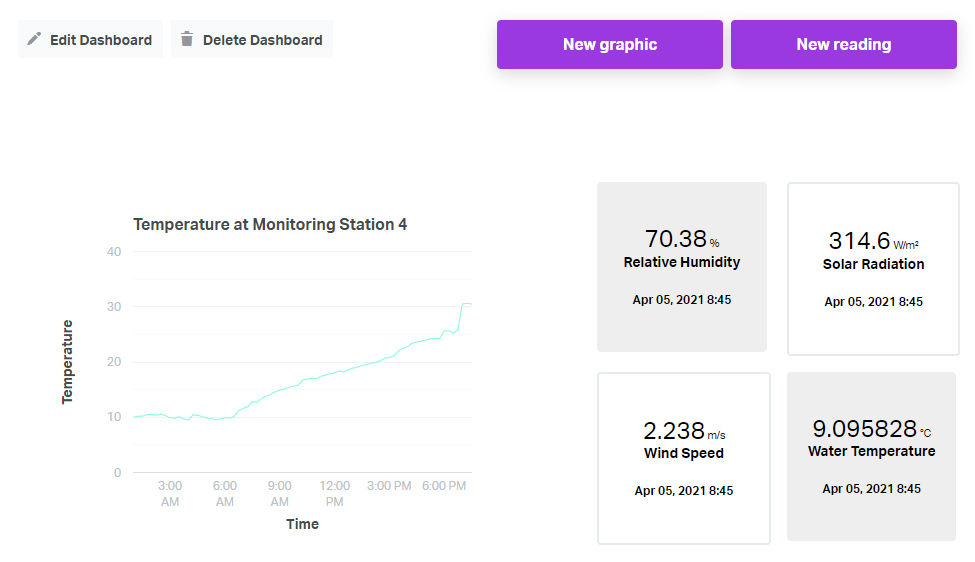
A graphic is a visual representation of your data. Graphics are displayed on your dashboard. They can be either a chart or reading value.

To create a graphic:
- On your dashboard, click on either the "New graphic" or "New reading" button on the top right corner.
- Use the design interface to build your graphic.
4. Add team members to your projects and to Datashift
Collaborate with your organization by adding people to Datashift. You can add people to Datashift two different ways.
Add new member to Datashift from your account settings:
- Click on your name on the top right corner of your screen.
- From the dropdown menu, click on "Settings".
- On your account page click on "Members" to bring up the form where you can add members by adding their email address and clicking "Invite".
Add new member directly to a project:
- On a project page, click the plus icon to the right of the edit and delete project buttons.

- Select "Add a new member" from the dropdown located below theAdd people to this projectheading.
- Enter the email address of the person you wish to invite.
- Select a role for this person.
- Click "Add" to add this person to your project.
Tip: When inviting people to your Datashift account they still need to be added to any project you want them to have access to. Each member can have different roles and access levels to any projects within Datashift.
5. Data sharing & privacy
When working within a project there are two levels of privacy you can have with your data:
- Private
This is the default setting for a project. Initially a private project is only accessible by you. You can add other team members and give them varying levels of access. - Available to the public
You can make any data in Datashift available to the public, anywhere from published research data to backyard sensor data. All public datafiles are made available to all Datashift users.
